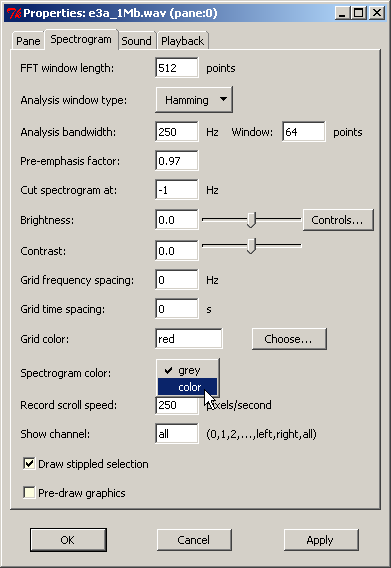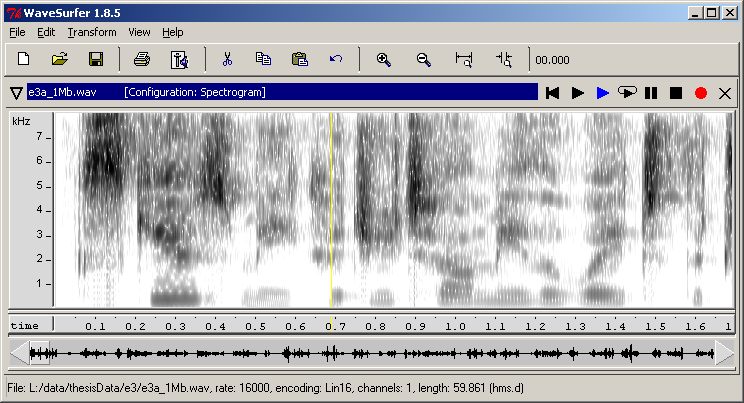
As we have seen on the previous page, waveforms can be fairly useful for identifying some interesting (high-level) features of speech. However, for an in-depth investigation of specific features of vowels, consonants and connected speech, the waveform view is certainly not the most useful view most phonetic analysis programs offer. A much more useful representation of the sound data is in form of a spectrogram. Unlike the waveform, which was a two-dimensional representation, the spectrogram actually provides us with a three-dimensional display of time (x-axis), frequency (y-axis) and intensity (z-axis), where the latter is represented by different degrees of ‘colour’ depth. Below, you can see two different variants of the same spectrogram, one in greyscale and one in colour.

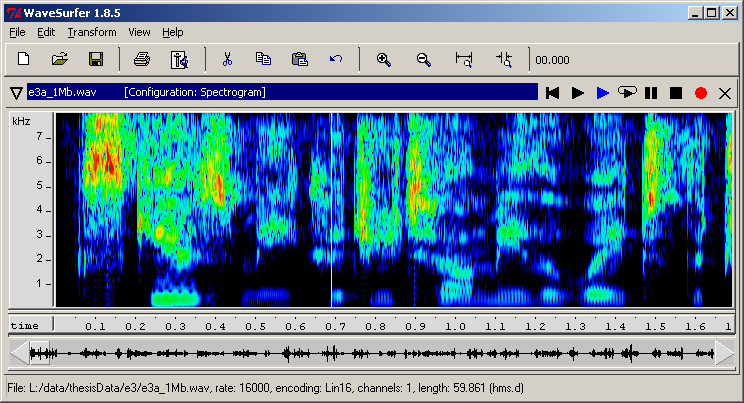
When working with this type of audio data, it is always important to bear in mind that, when we change the display, we’re actually only changing ‘the view on the data’, but not the data itself! In order to view our data in form of a spectrogram, we’ll now have a look at two different options, one we can use in case we’re already displaying the data in a different from, such as a waveform, and one where we select the display ‘from scratch’, when opening a new file.
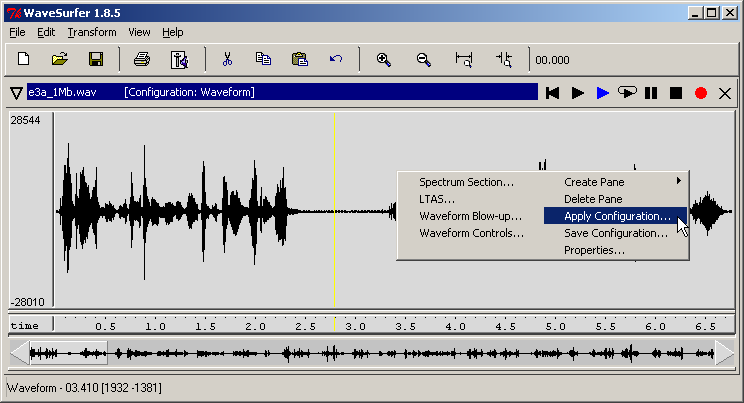
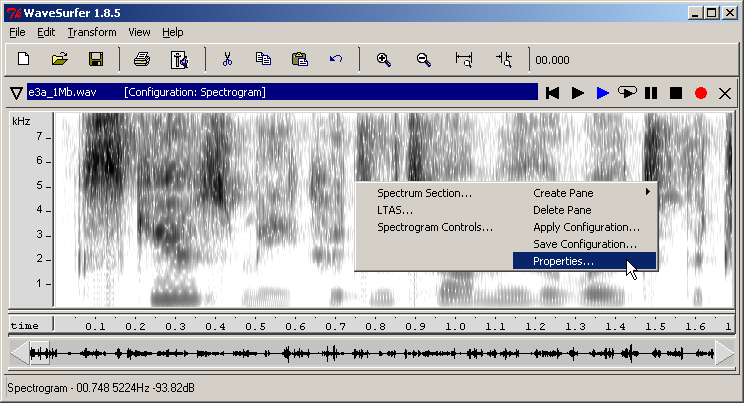 You should now get the following properties dialogue displayed: